A city is most often mapped for its physical properties. Maps are used to show how to get from A to B, to mark where there are roads, buildings and parks. The user experience of a city is less considered — how does the user feel when interfacing with these spaces? Can these qualities be mapped? For my masters thesis I explored this idea, using social media as a window into how we perceive and interact with physical space. Below is a condensed version of these thoughts
⠀
Social Media as the Dérive
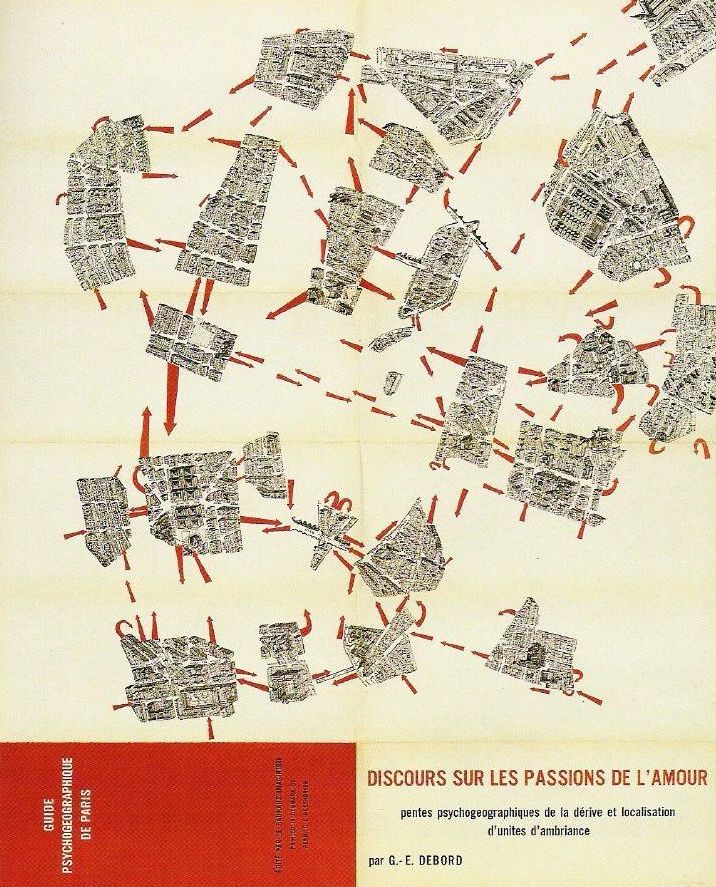
Psychogeography was introduced in the 20th century by Guy Debord and the Situationalists as ‘the study of the specific effects of the geographical environment, consciously organised or not...on the behaviour of individuals.’ Today, the term psychogeography is resistant to a specific definition, but for the purposes of this study, it will relate more closely to the definition of its original conception — as the ‘analysis of the absolute or relative character of fissures in the urban network, of the role of microclimates, of distinct neighborhoods with no relation to administrative boundaries.
Psychogeography was founded on the practice of walking; Debord developed a theory of the ‘dérive’, which involved traversing the city; recording the experience on film, photograph, manuscript or tape, while remaining acutely aware of the ‘flow’ of the urban environment. The Situationalists would let themselves be ‘drawn by the attractions of the terrain and the encounters they find there’ in an attempt to understand the city’s ‘ambience, spatial localisation, axes of passage and defences.’ There was a perception of the city as a site of mystery and an inherent desire to ‘reveal the true nature that lies beneath the flux of the everyday.’ Guy Debord and Kevin Lynch — who played a founding role in European and American psychogeography respectively — sought to document human interaction with the city through traversing the physical terrain and assessing their experience. However, this method leaves itself open to personal bias, as the results gathered could change dramatically depending on the person, time, weather and any circumstance that would arise during the dérive. Furthermore, there was no method of understanding the human experience of the city where the participant was free from knowledge of their own observation, which leaves gaps in the understanding of the how the everyday person lives and perceives the city.
However, the digital city paints a picture of the intangible urban processes that psychogeography sought out — an image that is crowd sourced and free from bias. The increasing production of digital content for social media, such as text, photos and videos, are allowing for new methods of interacting with, and studying cities. Through collecting, aggregating, mapping and analysing this data, social media is being used as an integrated approach to urban geography and planning which provides a much finer spatial and temporal scale than previous methods of study. Users of social media platforms interact with the built environment, and routinely record their experience in much the same way that Situationalists would on their ‘dérive’, but in an inadvertent (and therefore more genuine) way.
Where 20th century psychogeographers collected knowledge from individual people directly through interview, the digital city provides the opportunity to examine the flow of the city, and activities of people as inferred from their behaviour. The content contributed to the digital representation of the city, contains recordings that correspond to a specific time and location on the earth’s surface, along with the human experience which evoked the user to post — be it a picture snapped of an afternoon in autumn, or a tweet about a humorous interaction between strangers. Through social media data; I am providing a new psychogeographic methodology which can be used to describe and map the relationship between the urban environment and the invisible life of the city in a crowd-sourced way, which emerges from the people themselves. It should be noted however, that while this social media crowd sourcing casts a broad and comprehensive net; it is not all encompassing, as the digital image of the city built by social media users does not represent every community within Sydney.
The activity of the city
Debord mapped the psychogeography of the city in an attempt to uncover areas of the city to which people are consistently drawn, which he labelled, ‘centres of attraction.’ For Lynch, the moving elements in a city — in particular the activities of people — define the city as much as the stationary physical parts. He argued that as inhabitants we are not simply observers of the spectacle of the city, but are a part of it, on the stage with the other participants. He theorised that cities have nodes of activity, which he defined as 'concentrations, which gain importance from being the condensation of some use of physical character, as a street corner hangout or an enclosed square.’ While Debord and Lynch relied on walking and their own singular experiences to determine these areas, we can examine the invisible digital public realm to gain an insight into the movements and clustering of people within the built environment.
Through analysing the geo-spatial data from social media, the digital footprint of where people congregate in the highest densities can be expressed, creating a picture of the centres of attraction within a city. These centres of attraction are referred to as urban areas of interest or AOI in computational social science literature, and have been mapped in a variety of studies. In a similar manner to Lynch, Yingjie et al. (2015) identify that AOI are to be differentiated from an ‘urbanized area, as the former puts additional emphasis on people’s interests.’ While the physical city can construct zoning and district boundaries, an area of interest within a city is less easily defined and relies on an understanding of the activity of people within a city — an understanding that crowd sourced geo data provides.
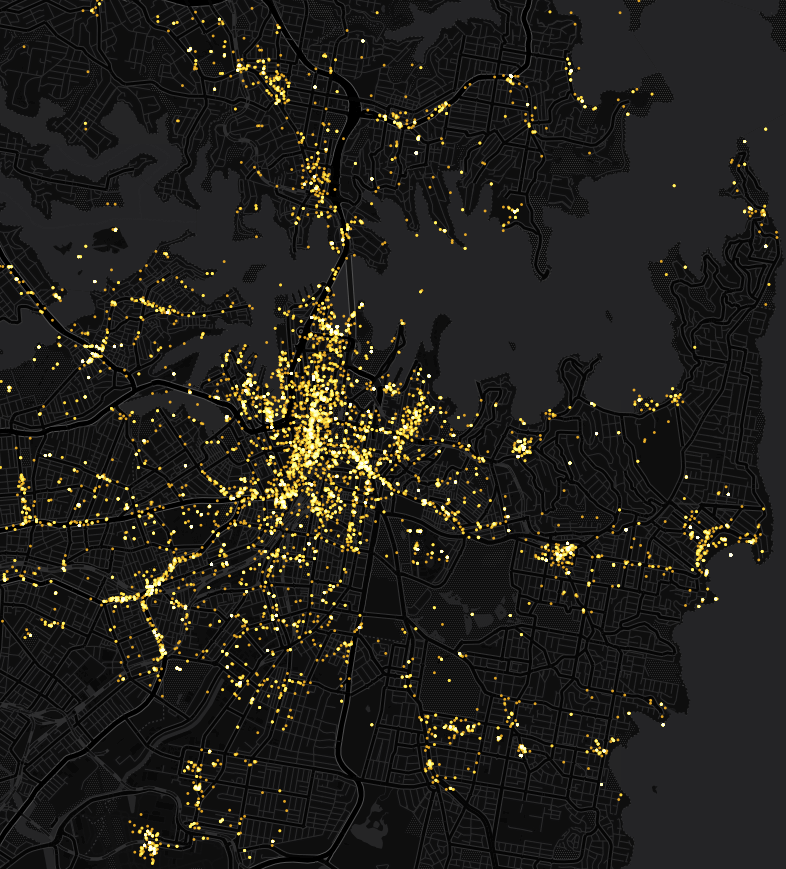
In Figure 1 I used a twitter dataset to visualise what Debord would label as the ‘centres of attraction’ of Sydney. Through projecting mined geo-located tweets over a map of Sydney, it becomes clear the geographic process of the twitter sphere, and the real world urban dynamics evident in the city of Sydney. The map produced is a display of real world human behaviour, and the intensity of this activity within the city.
The analysis reveals the largest hives of activity in Sydney, with the central business district being by far the biggest cluster of activity. It is interesting to note that — as Lynch identified — these areas do not follow any singular typology. In some locations it is a bay or beach that acts as the attractor point; (Double Bay, Bondi Beach, Rose Bay and Watsons Bay); at others it is a shopping complex, (Bondi Junction) university (UNSW) or airport (Mascot Airport). Sometimes it is simply a street heavy with activation as with King Street in Newtown. Although this information is evident to any local of the area; the visualisation exposes an intersection of the digital and physical city, and represents how this virtual overlay contains information that is not immediately apparent in its physical makeup.
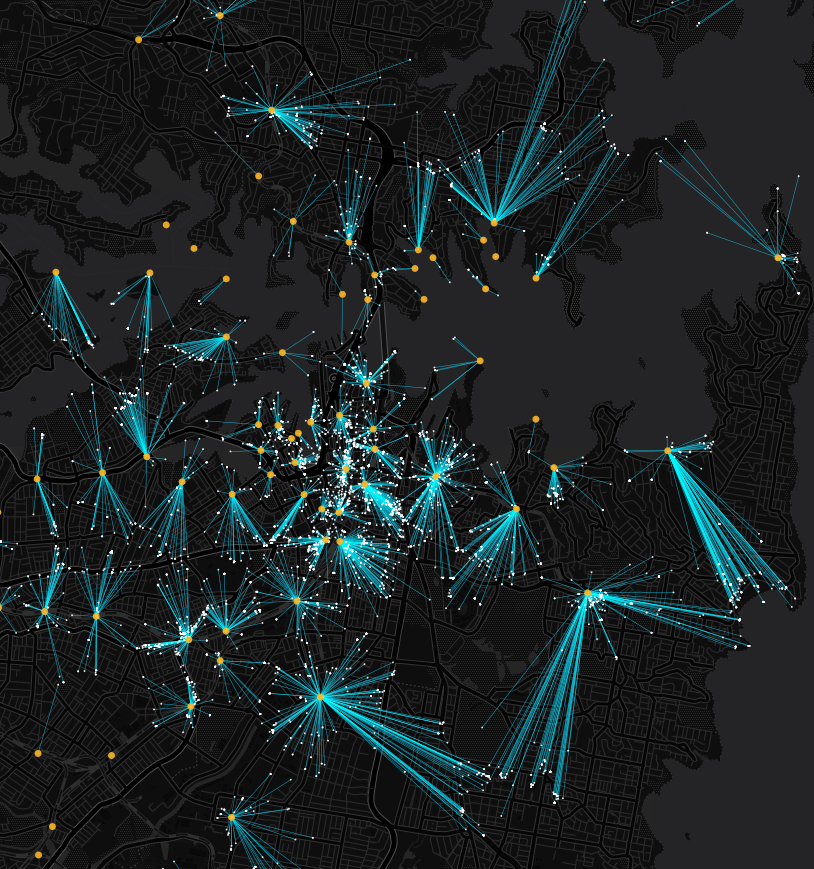
Figure 2 combines the human activity map with a map of major Sydney public transport locations. The yellow dots indicate all the Train Stations, Bus Interchanges and Ferry stops within Central Sydney; the white dots indicate the places that people have been tweeting from. The blue line displays the direct distance between the tweet location and the nearest major form of public transport.
This projection of the digital world can be used in a variety of ways. The map reveals the gaping holes in Sydney’s transport infrastructure and; based on the digital activity of the city; which areas get the most use and are in highest need of an upgrade. Transportation analysts can examine these regions to understand traffic flows and human mobility patterns, and how best to facilitate for these areas. If this type of study were to be conducted in a broader context, it could contribute to City of Sydney’s plan for 2030 of a ‘city of cities’, by identifying the activity centres that should be prioritised to support decentralisation of jobs and provide an improved consideration of transportation and land use.
The ambience of the city
A key characteristic that Debord studied in his theory of psychogeography was the emotional impact of the city on the psyche of the individual. He was interested in ‘ambience’ of the city and in the varying sensations that could be provoked when walking through different urban settings. He posited that there is an evident division of the city into zones of distinct psychic atmospheres, while some neighbourhoods are ‘gloomy’, others are ‘pleasant’. He determined that some places that are appealing and others repelling, a factor that cannot be determined solely on the basis of the historical period or architectural style of the area. He sought to map out these places through a ‘dérive’ in which he would record the emotional ‘unities of ambience, their main components and their spatial localisation.’
While an emotional evaluation of the city can never be an entirely objective endeavour, the virtual city provides a representation of this emotional dimension which is less open to bias than Debord’s method. The content uploaded to social media will often contain the emotion or mood of the poster, meaning the virtual realm contains the recordings of millions of people’s emotional responses in the urban space. The ‘wisdom of crowds’ allows this data to be more encompassing than a single users experience, and it has been proven that the observations and opinions shared on social media provide more reliable and trustworthy information than traditional methods like questionnaires and other sources.
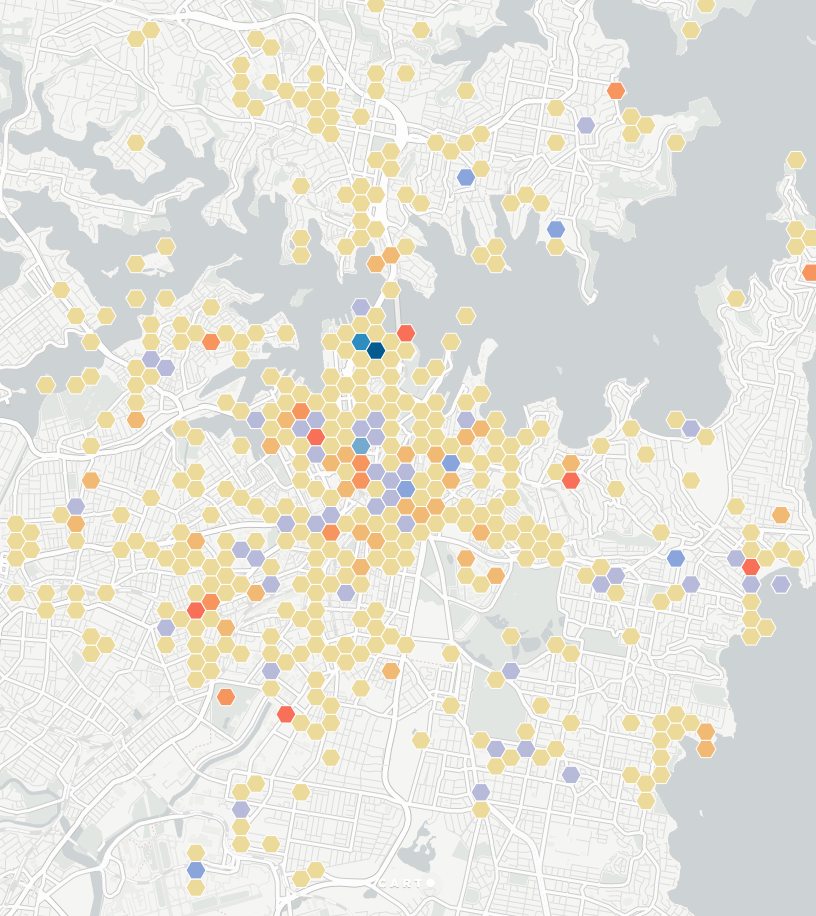
In Figure 3 I attempted to map out the emotional cartography of Central Sydney by analysing the digital sphere. The range of warm colours indicates where it is more common for positive emotions to be tweeted and the range of cool colours indicates where it is more common for negative emotions to be tweeted. The areas that express a darker shading of that colour range indicate a heavier frequency of that emotion.
This mapping exercise had a varying level of success and it cannot be said that it is any better at identifying the emotional cartography of the city than Debords’ methods. The walking ‘derive’ is more attuned to a nuanced reading the space and ambience of the streetscape, so that Debord would detect ‘the sudden change of ambience in a street within the space of a few meters.’43 However — as previously mentioned — through reading the digital city to extract this information, the study is free of the individual bias’s that accompany Debords’ psychogeography.
There are numerous factors which cause inconsistency in the conclusions that can be drawn from this map, but the fact remains that the virtual realm provides a valid methodology from which the emotional geography of the city is read. Perhaps with a larger dataset, one taken over the span of multiple years, this methodology could be refined to a point where the emotion cartography can be used to assess not only what people are doing, but why they are behaving in a certain way.
As our world is becoming increasingly urbanised and digitised, there is tremendous value in studying both the virtual and physical public realm in order to understand our urban environments. This study contributes to that knowledge and indicates how this learning can be used to inform an array of disciplines, from tourism and event management to city planning and transport infrastructure.